Layers and Tooltips
Add New Layers
Data layers are provided by the map service and feature service connections provided in the previous step. Layers can consist of point, line or polygon data. If the services require authentication, user credentials must be added.
To add layers to the map, follow the steps below.
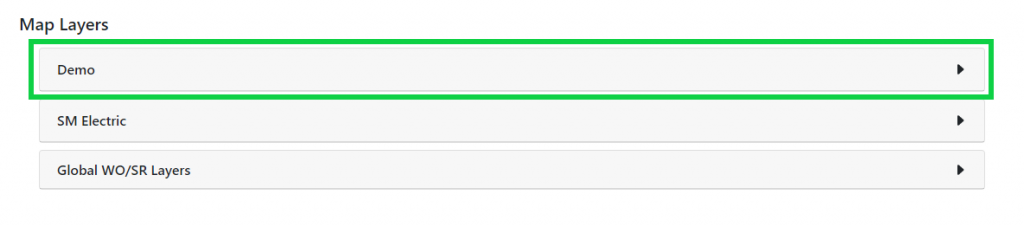
- In the configuration settings, select the Layers tab on the top navigation bar.

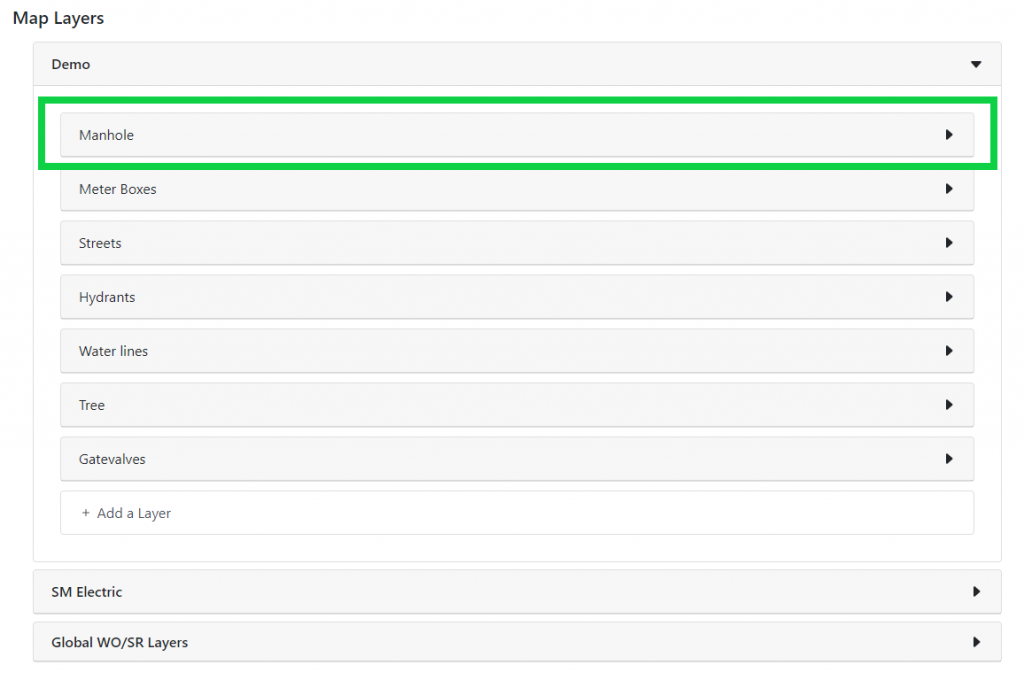
- Connected map servers, feature services, and work orders will be listed in the Layers navigation. Select the name of the map service that contains layers that should be configured and added to the map. Layers contained within each service will be listed below.
- See Global WO/SR Layers section for configuring work order and service request layers.
- See Global WO/SR Layers section for configuring work order and service request layers.
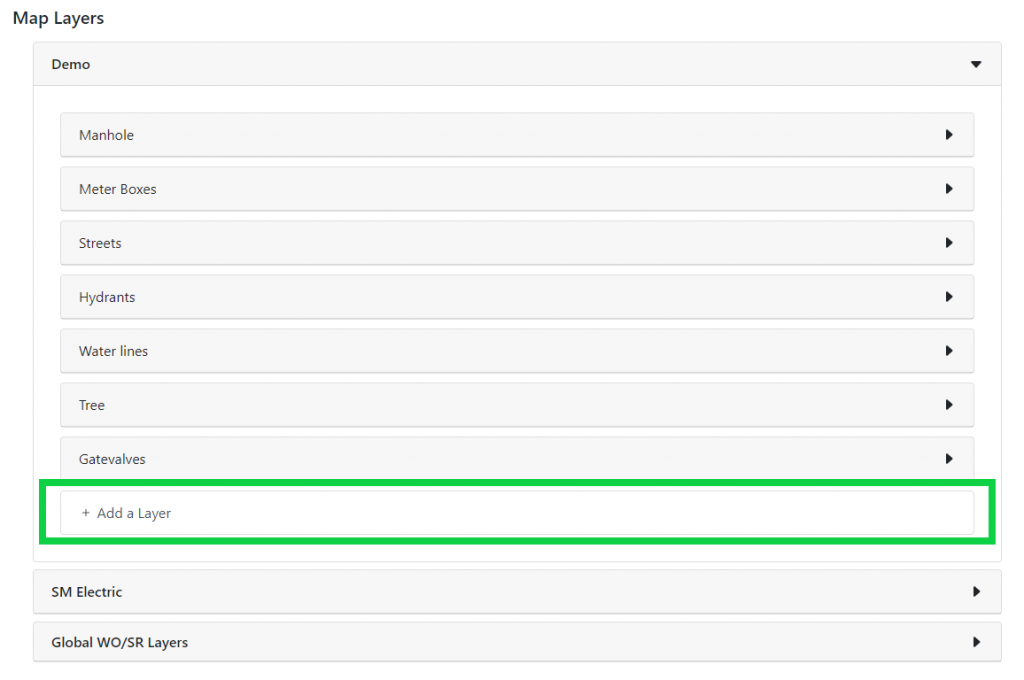
- Select Add a Layer. If there have been no layers previously configured, Add a Layer will be the only option listed. If layers were previously configured, they will be listed here. Once Add a Layer is selected, a list of layers from the feature or map service will be displayed.
Configure New Layers
- Select Configure next to the layer name to be added to the map.
**If PowerSync is configured, a pop-up will appear that allows to pull configurations from PowerSync.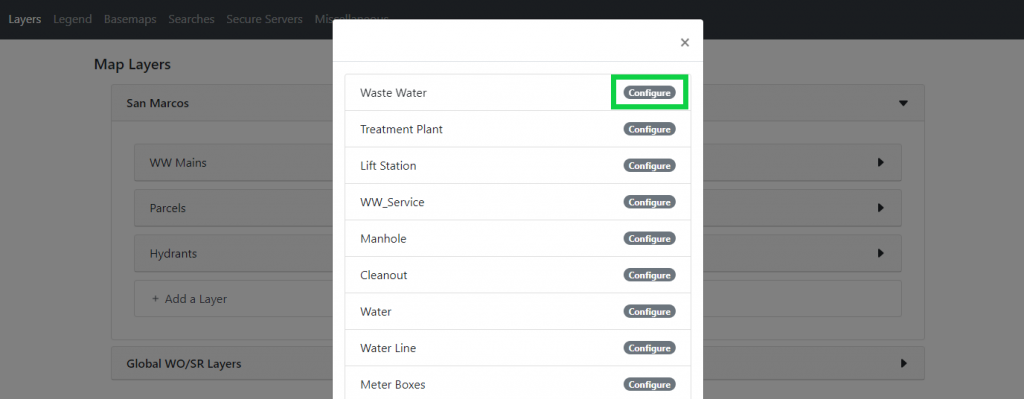
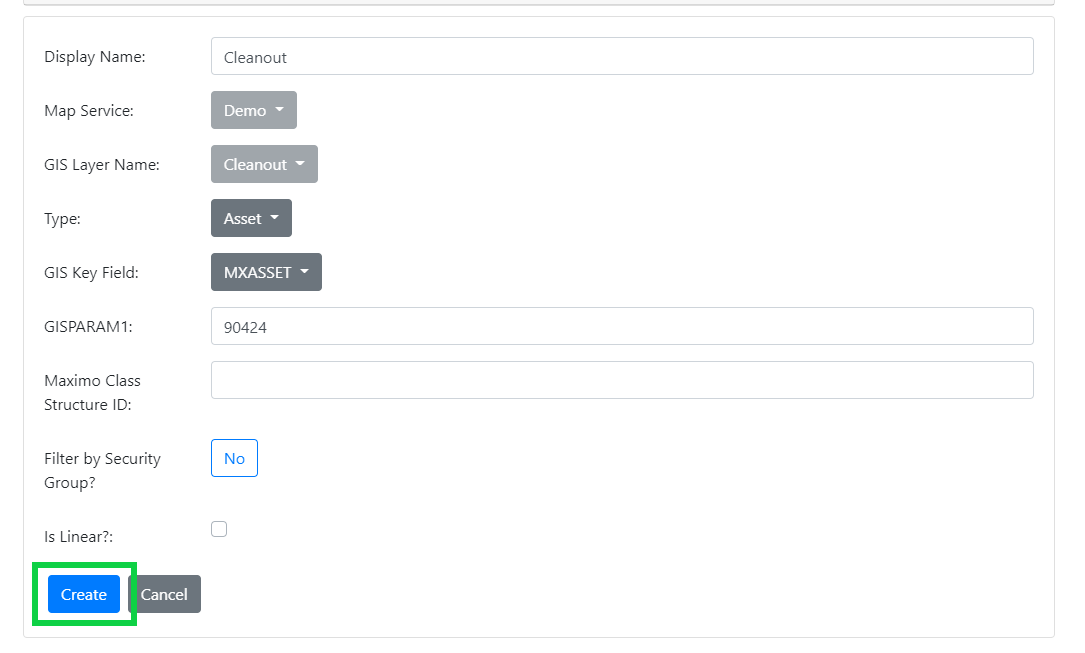
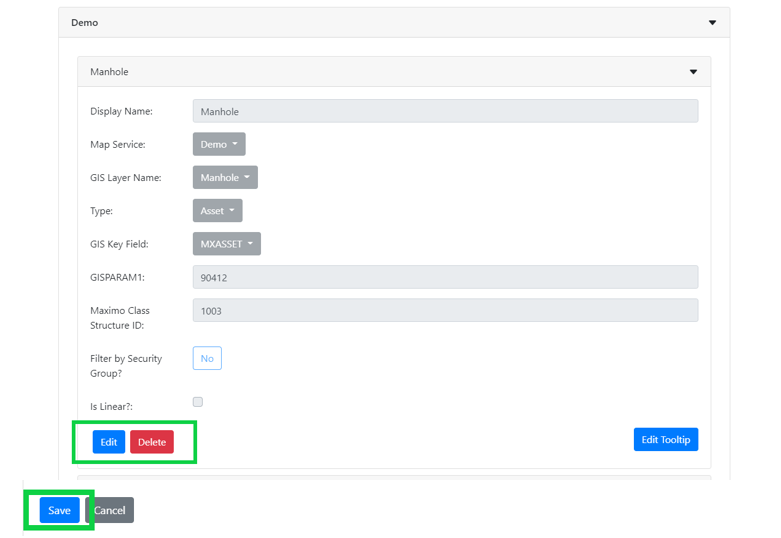
- Set the parameters listed below. Once the parameters are set, select Create. To configure the tooltip, see the Configure Tooltip documentation section.
- Display Name
- Name layer will display in layer list on map
- Type
- Layer type (asset, location, GIS–only (not synchronized))
- GIS Key Field
- Field that links GIS and Maximo data
- GISPARAM1
- ActiveG code for GIS data type
- Maximo Class Structure ID
- Filter by Security group?
- Should layer access be filtered based on Maximo security groups? If no is selected, all Maximo users with access to MapEngine will have access to this layer.
- Is Linear?
- Select the checkbox if the layer is linear data, not a point or polygon.
 **A pop-up will appear that the layer has not yet been added to the legend. Select Yes to add the layer to the legend. See Configure Legend documentation for further instructions.
- Select the checkbox if the layer is linear data, not a point or polygon.
- Display Name
Configure or Delete Existing Layers
- Select the layer where configurations should be edited.
- Select Edit to edit the configurations, or Delete to remove the layer from the map. Select Save when editing is complete. To edit the tool tip, see the Configure Tooltip documentation section.
Add New Work Order and Service Request Layers
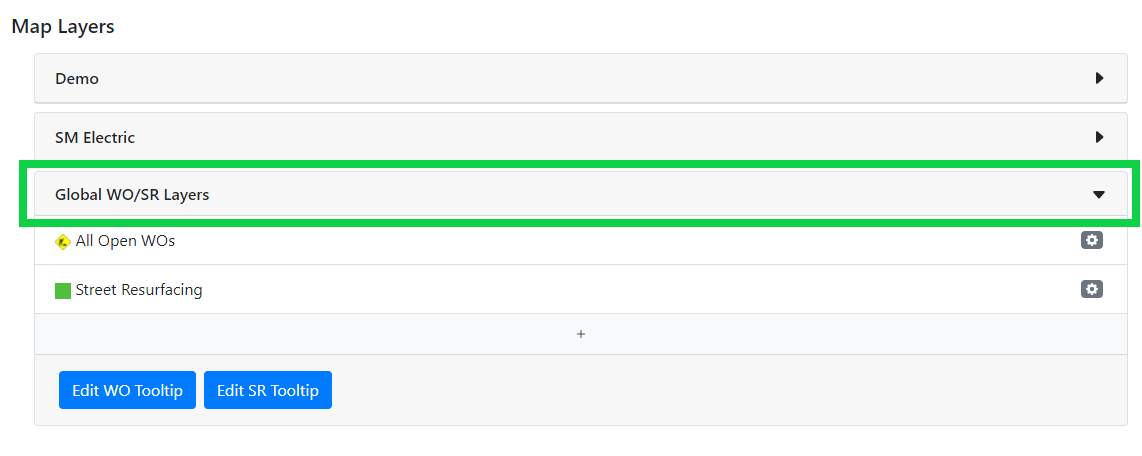
To add a work order or service request layer, select Global WO/SR Layers at the bottom of the Map Layers list. In this example, there are two work order layers already configured.
To add a new work order or service request layer, select the “+” at the bottom of the expanded list. If no layers have yet been configured, it will be the first item in the list.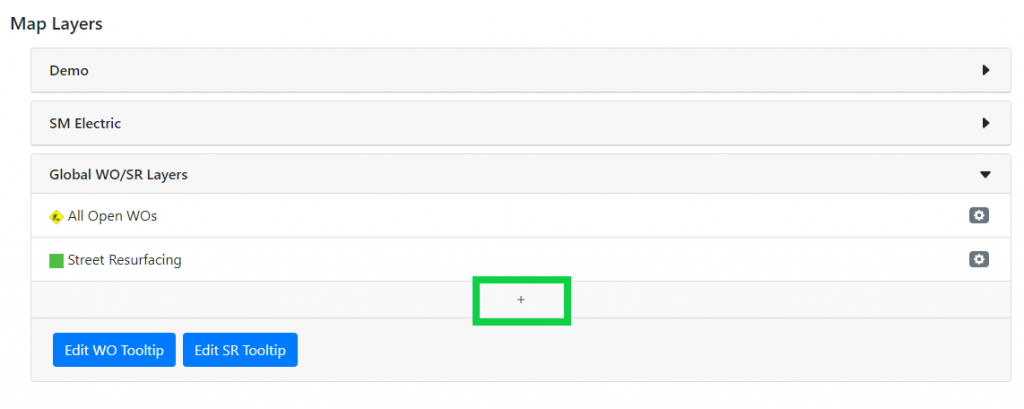
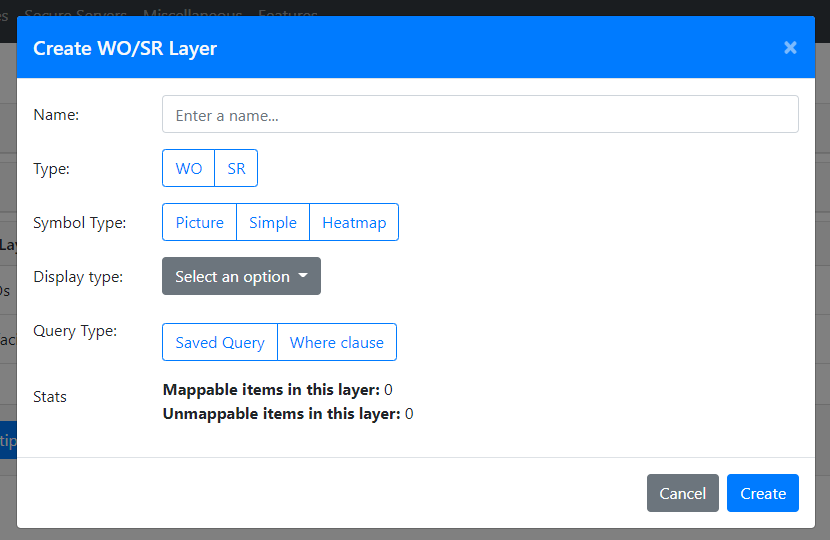
Set the configurations listed in the Create WO/SR Layer
- Name of the layer
- Type: work order or service request
- Display type: cluster or individual records
- Clustering shows groups of records that are clustered together spatially as one large symbol at a smaller map scale and breaks apart into more, smaller symbols at larger map scales. This allows for a less cluttered map at smaller scales.
- Individual records will show one symbol for each record in the layer at all map scales.
- Query type: saved query or where clause
- Select the query type to query the records from Maximo. A saved Maximo query or custom where clause can be chosen.
- Stats will show how many records in the query can be shown on the map and how many cannot be shown on the map.
Configure Tooltip
A tooltip shows the data associated with the features on the map. Data shown in the tooltip can be shown from both Maximo and GIS. Calculations can be used to create custom data within the tooltip displays.
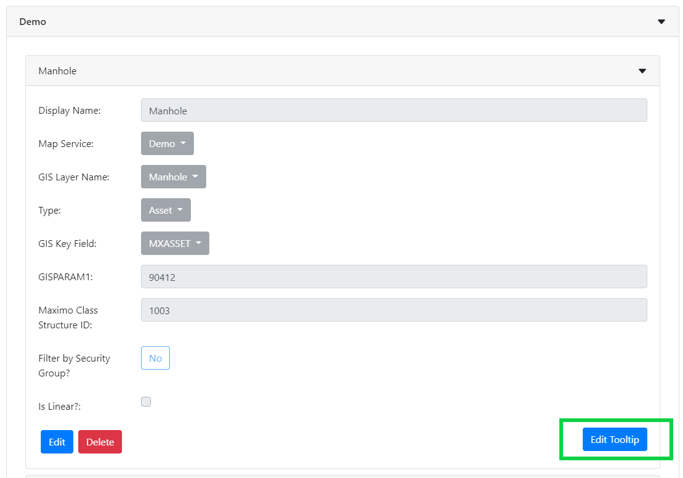
To configure the tooltip, go to the Layers tab in the Settings, then select the layer to configure the tooltip. Select Edit Tooltip from the list of options shown below the layer.
The tooltip consists of variables that represent Maximo and GIS fields. The tooltip editor combines variables, text and calculations to display the desired information for each map feature:

- Variable name – assign a name to the variable that will represent the Maximo or GIS field.
- Select which data source the variable will represent (Maximo or GIS).
- Select the field that the variable will represent.
- Set the alias that will be assigned to each set variable or calculation of variables (see #5.).
- Set the variable for the alias assigned in step 4. Multiple variables, concatenations, and strings of text may be added here.
- To add a field condition to control the visibility of a tooltip row, select the ? on the same line as the field name, then enter a conditional statement. This statement must be in JavaScript and use the variables on the queried record shown at the top of the screen. For example, if you wanted to only show the Maximo asset status field when the status is not OPERATING, you would add a field condition like this to the status field: status!=’OPERATING’.
Here are more examples of operators you can use:
Operator Example is null fieldvalue == ” is not null fieldvalue !== ” equals fieldvalue == “OPERATING” not equal fieldvalue != “OPERATING” and fieldvalue1 == “OPERATING” && fieldvalue2 != “OPERATING” or fieldvalue1 == “OPERATING” || fieldvalue2 != “OPERATING” - To remove a line or variable from the tooltip, select the X next to the input box from #5.
- Select Submit when tooltip editing is complete.
The Create WO button is automatically added to the tooltip and will create a new work order in Maximo when selected.